Boat accident rates by type and brand
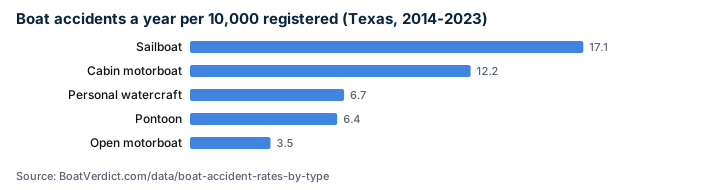
In Texas from 2014 to 2023, sailboats had 17.1 reported accidents a year per 10,000 registered, against 3.5 for open motorboats. By brand, across Texas and New York, rates run from 1.3 to 12.6 per 10,000.
USCG Boating Accident Report Database 2014-2023; Texas and New York registrations as published in 2026.
By boat type, Texas
| Type | Registered in TX | Accidents 2014-2023 | A year per 10,000 | Fatal a year per 100,000 |
|---|---|---|---|---|
| Sailboat | 2,458 | 42 | 17.1 | 48.8 |
| Cabin motorboat | 9,616 | 117 | 12.2 | 3.1 |
| Personal watercraft | 89,241 | 596 | 6.7 | 4.7 |
| Pontoon | 25,716 | 164 | 6.4 | 14.4 |
| Open motorboat | 400,855 | 1390 | 3.5 | 5.6 |
By brand, Texas and New York
| Brand | Registered TX+NY | Accidents 2014-2023 | A year per 10,000 | Machinery failure share |
|---|---|---|---|---|
| Baja | 2,063 | 26 | 12.6 | 6% |
| Wellcraft | 4,072 | 50 | 12.3 | 6% |
| Chris Craft | 2,911 | 31 | 10.6 | 8% |
| Grady-White | 4,511 | 46 | 10.2 | 5% |
| Mastercraft | 5,302 | 47 | 8.9 | 3% |
| Regal | 4,037 | 34 | 8.4 | 7% |
| Sea Ray | 21,153 | 174 | 8.2 | 5% |
| Correct Craft | 2,754 | 22 | 8 | 2% |
| Crownline | 4,437 | 35 | 7.9 | 4% |
| Malibu | 5,983 | 46 | 7.7 | 2% |
| Larson | 3,985 | 29 | 7.3 | 5% |
| Tige | 3,404 | 25 | 7.3 | 4% |
| Cobalt | 6,837 | 47 | 6.9 | 6% |
| Bayliner | 15,854 | 79 | 5 | 5% |
| Boston Whaler | 11,229 | 50 | 4.5 | 3% |
| Four Winns | 7,001 | 30 | 4.3 | 6% |
| Mako | 5,790 | 24 | 4.1 | 4% |
| Chaparral | 9,749 | 38 | 3.9 | 5% |
| Triton | 5,714 | 22 | 3.9 | 3% |
| Glastron | 7,529 | 28 | 3.7 | 4% |
| Ranger | 13,945 | 38 | 2.7 | 4% |
| Skeeter | 14,672 | 35 | 2.4 | 3% |
| Bennington | 11,632 | 28 | 2.4 | 2% |
| Starcraft | 16,245 | 31 | 1.9 | 3% |
| Tracker | 41,912 | 53 | 1.3 | 4% |
Brands with at least 2,000 boats registered in the two states and 20 accidents. Machinery failure share is over all of the brand's USCG records since 1995. Personal watercraft are left out; brands that also build them (Yamaha, Sea-Doo, Kawasaki) get no rate because New York does not publish boat type.
Method
- Accidents come from the USCG Boating Accident Report Database (FOIA releases published by the Data Liberation Project), counted by vessel. Registrations come from the Texas and New York open data portals, the only states that publish boat-level registration data. We count accidents in those states' waters from 2014 to 2023 and divide by today's registration count, so the rate is per registered boat per year.
- Only accidents above the federal reporting threshold are recorded. The rate does not adjust for how many hours boats are used: a type or brand used more, or in rougher water, will show more accidents. Paddlecraft are left out because Texas registers only motorized ones. We never show accident narratives.
- Prices are asking prices, not sale prices. No free source publishes US used-boat sale prices.
- Listing sources: Craigslist, Rightboat, BoatCrazy and MarineMax. A boat posted many times or in several cities is counted once.
Use this chart
You may embed the chart with a link to this page. Paste this:
Chart file: https://boatverdict.com/data/boat-accident-rates-by-type/chart.svg. Questions about the data: contact us.